
Topic: Data and Analytics
17 assets about “Data and Analytics”.

Agent Performance Triage
Turn a live agent's analytics and transcripts into a diagnosis and a prioritized improvement backlog.

Chart Builder
Generate clean, consistently-styled matplotlib charts (bar, line, scatter, histogram, pie) from a DataFrame or CSV with one call.

Copilot Adoption Dashboard
Using exported files from MAC usage reports, build html Copilot Adoption Dashboard with integrated framework that suggest next steps

Dataverse Table Lookup
Search any Microsoft Dataverse table, browse matching records, and drill into full record details — sourced live via the Dataverse MCP Server.

Lab Column Mapper
When a health system's lab results ingestion pipeline hits an unknown column header, this skill semantically matches the source column against the canonical clinical schema (LOINC-anchored), scoped by lab and clinical domain, and writes a suggested mapping to a Dataverse review queue for a clinical informatics steward to approve.

Meeting Analyzer
Analyzes meeting content pasted as text or provided as audio/video transcripts. Delivers a structured intelligence report: explicit decisions and action items, participant persona profiles, and — most importantly — hidden insights: unspoken tensions, implicit risks, unresolved topics, and signals that were not made explicit during the meeting but are critical to the context.

Monte Carlo Analysis
Run Monte Carlo simulations from natural-language risk inputs — triangular, normal, uniform, or log-normal — and return percentiles, a histogram PNG, optional interactive HTML, and a downloadable results spreadsheet.

Pattern Radar
Scans your recent Microsoft 365 signals to surface recurring patterns worth productizing — things you keep explaining (blog candidates) or multi-step tasks you keep doing by hand (automation candidates).

Pattern Radar (Scheduled)
Twice a week, scans your recent Microsoft 365 signals and posts a Teams summary of recurring patterns worth productizing — things you keep explaining (blog candidates) and multi-step tasks you keep doing by hand (automation candidates). Read-only and privacy-aware.

PDF Table Data Conversion
Extract tables from a PDF document (e.g. contract rebate or pricing schedules) and convert them into a clean, workable Excel spreadsheet or CSV.

Power BI Model Review
Review a Power BI or Analysis Services semantic model (TMDL, BIM/JSON, or a pasted table/measure list) for relationship, DAX, date-handling, and naming issues, with corrected DAX for anything flagged.

Root Cause Analysis
Diagnose the true cause of a problem — not just its symptoms — using structured techniques like 5 Whys, Fishbone diagrams, and contributing factor analysis.

Route Map Visualizer
Visualize routes and locations on a map. Accepts pre-ordered stops with coordinates from upstream connectors (Azure Maps, Bing Maps, Dataverse, CRM) plus optional road geometry, leg distances, and durations. Produces PNG, interactive HTML (Leaflet/OSM), GeoJSON, KML, deep links, and QR codes. Fully offline Python engine — road geometry rendered directly when provided, or OSRM used browser-side as a schematic fallback.
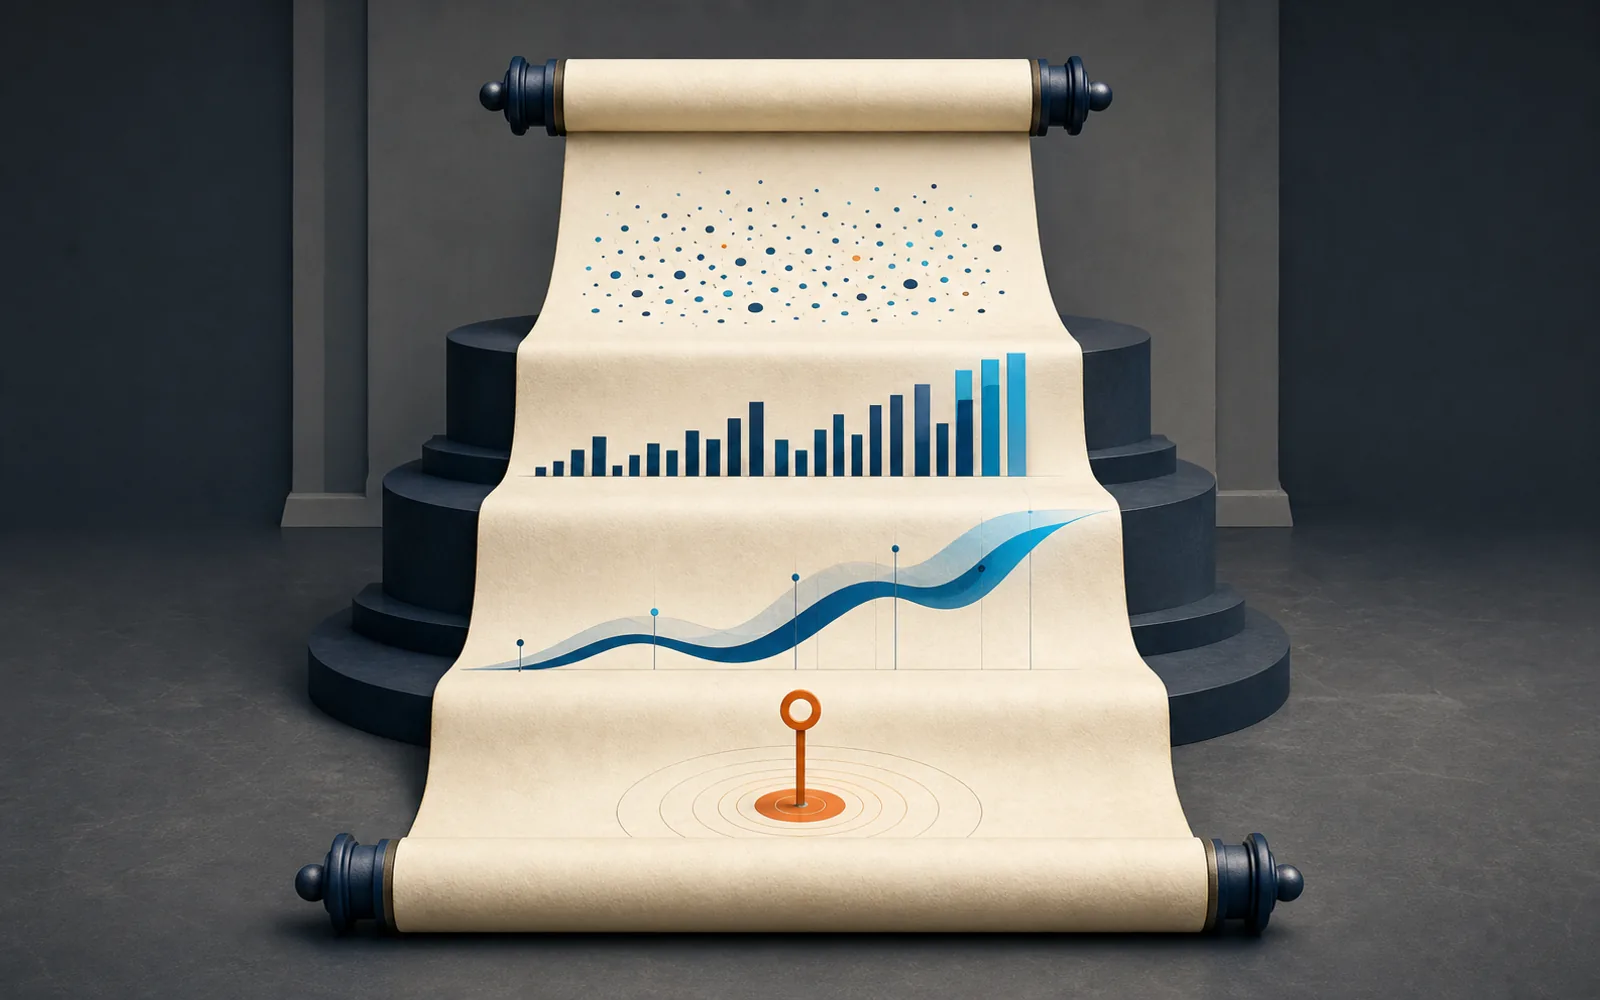
Scrollytelling Data
Turns data into a scroll-driven HTML story.

SharePoint List Formatter
Turns any SharePoint list data into a clean, consistent markdown table. Dynamic columns based on list type and query, plus a one-click Open link for every row.

SharePoint List Insight Report Generator
Automatically discovers and validates a SharePoint list within a connected knowledge source, analyzes its structure and data, identifies key business insights, and generates a downloadable interactive HTML report. The report includes dynamic filters, interactive charts, sortable and searchable tables with pagination, detailed record drill-down through modal popups, and direct links to open items in SharePoint. If the requested list is not found, the skill suggests available lists and closest matches before stopping the analysis.

Work IQ Signalboard
Turn four weeks of Calendar, Mail, and Teams chat activity into a colorful dashboard of reconciled Work IQ counts.